

Evaluation design answers an important set of questions about how the evaluation will roll out, specifically it answers particular questions related to data collection:
- What is the context of your evaluation?
- When will you collect it?
- From whom?
- How?
What is the context?
Before planning for data collection, analysis and use, you should answer some additional questions about the context of your evaluation.
- What external factors impact the way your evaluation will be carried out or the way data will be (or won’t be) used?
- What resources – money, time, expertise, etc. – are available to support evaluation efforts?
- What characteristics of your target audience (when you have one identified) might impact the evaluation? Consider literacy levels, disability status, age. For example, if you are working in a school setting, do you need to get school administration to approve any evaluation tools you might use? Or only written tools? Do they require parental consent? If so, is it passive or active?
- What funder restraints or guidelines do you need to follow or meet?
When?
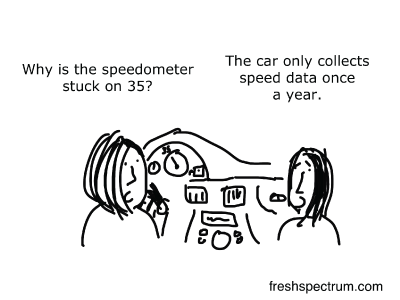 How often do you need to collect data in order to tell a meaningful and accurate story about your efforts? The cartoon points out a clear problem with collecting data too infrequently. Collecting data too infrequently yields answers to your questions that are insufficient or not meaningful. On the other hand, you don’t want to collect so much data that it becomes too cumbersome to analyze and use it all.
The timing of data collection depends on many factors including the evaluation question you’re answering, the type of intervention you’re evaluating, the budget you have allocated for the evaluation.
Nature of the Intervention
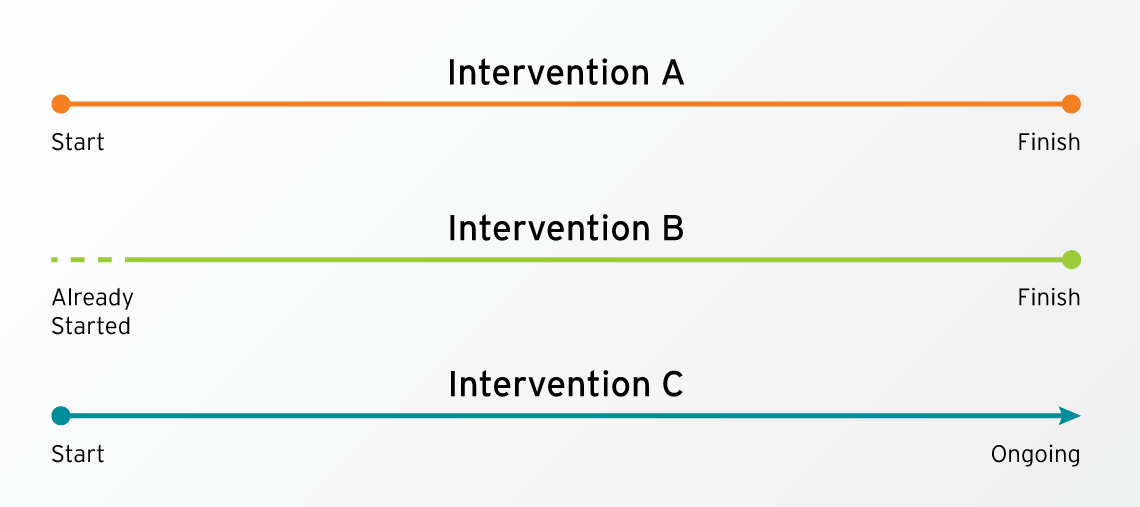
Just by way of example, consider the chart below that depicts three different interventions that you might need to evaluate. These might benefit from or even demand different data collection protocols.
Intervention A is a time-bound program. At the time during which you are planning the evaluation, the program has not yet started but it will have a starting point and an ending point.
Intervention B is one where the intervention has already started before an evaluation plan was in place. It still has a definite end point.
Intervention C has a definite starting point but is intended to continue indefinitely. That is, the program has no pre-determined ending point.
 See below for more information on the following three options for data collection:
Pre/Post
The standard practice for preventionists for some time has been to conduct evaluations using what is called a pre- and post-test design which means they collect data before they implement their prevention programming and again after they implement it. They then gauge their success by comparing scores at the end of the programming to the scores at the beginning. While this might be the most used design for collecting data, it is not necessarily the ideal design for all interventions or program components nor is it ideal for all evaluation questions.
First, it’s helpful to know that this design applies to a variety of data collection methods, not just the written surveys that are frequently referred to as pre-tests and post-tests.
The following case study highlights one way that the pre- and post-test model is often implemented in prevention work.
Consider the following:
![]()
The following case study is a combination of multiple real case studies.
Monica from the local rape crisis center plans to implement a nine-session prevention program in a local high school. She will be working with 25 freshmen over the nine weeks of the program. On the day of her first session, Monica walks into the classroom, introduces herself, and hands out 25 copies of a 10-question pre-test. She instructs the participants to complete them in silence and hand them back to her in 5 minutes. At the conclusion of 5 minutes, Monica collects the pre-tests and puts them in a folder in her bag. At that time she talks to the group about how they will spend the next nine weeks together, does a few icebreakers to get to know the students, and introduces them to the concept of gender socialization.
Fast forwarding to session 9, Monica does a closing circle with the group and, during the last 5 minutes of the class, hands out 25 copies of the post-test. She again instructs the group to complete the test in silence and on their own. When she collects them, she thanks them for their participation. The bell rings at that point, and the students move on to their next class.
Arriving back at her office, Monica pulls out the pre- and post-tests in order to enter the data into her spreadsheet. Several of the tests are difficult to enter because students skipped questions or circled multiple options on each question or did not complete them at all. She decides to just keep all of the ones that are completed correctly, enters them, calculates the differences from the pre-test to the post-tests, enters the numbers in her monthly report, and puts the tests in her file cabinet.
So, what’s nice about this design?
For an intervention like Intervention A the pre-post design establishes a time-bound baseline or starting point of behaviors, attitudes, norms, etc. before you start your work and a nice comparison point at the end of your work.
Since there are only two data collection points, it can be relatively easy and cost effective to implement depending on the tools and processes you use and the type of data you’re collecting. If you were to do, a pre/post design that involved a focus group before and after a program, that probably would be more time and resource-intensive than using a pre-test and post-test.
You can add on to the typical pre/post design with a follow-up data collection point at a date well after the completion of the program to see if the impact of your efforts varies with the passage of time. This design is preferable to a standard pre- and post-design for initiatives like sexual violence prevention work that hope to create stable changes in attitudes, behaviors, skills, and norms.
What are the pitfalls or drawbacks of the pre/post design?
For many of us, this process represents precisely how we were trained to “evaluate” our work. Moving through the story from the beginning, several methodological and ethical issues present themselves if we look closely:
Prevention work is about relationships, and it’s difficult to build a relationship with people when the first thing we do is walk into the room and hand them a test. This is especially true when we are working with groups who are used to being tested or studied or having data collected about them, as is sometimes the case for marginalized populations in our society. Walking in and immediately offering them a test does not set the tone that there is any reason to expect a different kind of relationship, certainly not one that is more equitable. A barrier has already been established.
Young people in many school systems are rigorously and frequently tested. When we go into their spaces, we often also show up with a “test” in hand. Prevention workers report that these young people often don’t take pre- and post-tests seriously – circling many responses or no responses – resulting in unusable data. They have no reason to buy in to the evaluation process if they don’t yet understand the meaning or utility of the data.
Even if the participants thoughtfully complete both the pre- and post-tests, the data must be used in order for that to matter and for the data collection to be ethical. When we collect data related to sexual violence prevention efforts, we often ask about sensitive issues such people’s relationships, sense of self, and experiences with oppression and violence. Answering these questions can be painful and emotional and certainly requires people to give of themselves in the process. As a result, we owe it to them to use the information they have given us in the most meaningful way possible, and, if we discover the data is difficult to use in a meaningful way, we need to adjust accordingly rather than continuing to collect the same kinds of data in the same ways.
Collecting data only before and after an intervention allows no possibility for mid-course corrections. If you’re not on target to reach your intended outcomes, you won’t know that until the program is completed. Your ability to make claims about your contribution to the outcomes represented on the post-test is limited since you don’t have any data in the middle to show trends of change or to highlight the possible influence of other factors on the outcomes of interest.
For some workarounds for this and other data collection issues, see the handout on Data Collection Hacks. To see an example of how the pre- and post-test model often shows up in our prevention work, check out the case study below.
Retrospective Pre/Post
A retrospective pre/post design involves collecting data only at the end of the program, but you collect data related to both the state of things before the program and after the program at that time.
What’s nice about this design?
This design is useful in a variety of situations. For example, in intervention B where the intervention has already started before an evaluation has been designed, there’s no chance to get a true baseline at the beginning of the programming. Such a situation is not ideal, but, in certain instances, this will be preferable to not collecting any data at all.
When collecting data about changes experienced by individuals, a retrospective design is especially useful for gauging a person’s sense of how they’ve shifted (Hill & Betz, 2005) over the course of the intervention and for measuring actual change on domains that would have been difficult for people to accurately gauge at the beginning of a program (Nimon, Zigarmi, & Allen, 2011). Consider the following example:
![]() Let’s pretend I am in participating in your education-based prevention program, and you hand me a survey on the first day of the program.
Let’s pretend I am in participating in your education-based prevention program, and you hand me a survey on the first day of the program.
One of the items on it reads:
I have sexist attitudes. OR I engage in sexist behaviors.*
I’m given options to indicate how often I engage in either of those. (This is called a frequency scale.) Assuming I have a general idea what the term “sexist” means, I probably also have a sense that engaging in sexist behaviors or having sexist attitudes is a bad thing. I know that a good person would never or minimally have such attitudes or behaviors, and that means I know the “right” answer to this. I circle the response that either says “never” or “very rarely” because I want to give you the answer you want. (When I select an answer based on what I think you want to hear, that’s called social desirability bias.) Additionally, I might genuinely believe that I engage in very few or no sexist behaviors or harbor very few or no sexist attitudes. In that case, I would also endorse a low frequency for this behavior.
After this survey, we spend six to nine weeks together during which time you teach me about gender-role socialization and gender inequality, including the many attitudes and behaviors that constitute sexism. During this time, I have many “aha” moments where I realize that attitudes and behaviors I’d considered harmless before are actually harmful toward women and driven by sexism. When you give me the post-test, I might be in a state of examining how I have behaviors and attitudes I need to change but that I have not yet changed. At that point, I am likely to endorse a higher frequency than when I completed the pre-test, and this makes it look like your efforts negatively impacted me. (When a participant learns more about a certain concept during the intervention and that impacts the way they respond on the post-test as compared to the pre-test, that’s called response-shift bias.) On the other hand, I might have already started to shift my behaviors and attitudes, in which case I might endorse approximately the same frequency that I did on the pretest. This will make it look like your program didn’t have any impact on me. (When responses on a pre-test are so high as to make it difficult or impossible to see change at the post-test, this is called a ceiling effect.)
However, if you asked me to reflect on my growth over the program and complete an item like the one above about how I was when I came into the program versus how I am at the end of the program, I can indicate the change that occurred for me because I have all the information I need to answer honestly. That is, I now have a better idea of what sexism is and how it manifests in attitudes and behaviors. In the beginning, I didn’t know what I didn’t know.
|
* These questionnaire items are here only for the sake of an example so that issues various types of biases can be addressed. Questions such as these have limited utility in the real world because they contain terms that people might not know and are overly general. (However, they might be useful for gauging exactly what they are asking – a person’s sense of their own sexist attitudes or behaviors.) For information on good survey questions, check out this short and simple guide by Harvard University Program on Survey Research (2017). |
In addition to working well for issues like the one described above, the retrospective design can also be good for measuring someone’s likelihood of engaging in certain pro-social behaviors. We can see this with an opposite example to the one given where you might ask about the likelihood that someone will interrupt bullying or sexism. Most of us want to believe that we will do these things. If you have a prevention program that’s focused in increasing skills and motivation to intervene in these situations, it might be best to ask this retrospectively so that participants can indicate more accurately whether or not that has changed for them. That is, if you can’t measure behavior directly and need to measure behavioral intent, consider this design over the standard pre/post design.
Retrospective measures also make it easier for you to track data from individual participants. With measures administered at the beginning and end of the program, you can only compare individuals if you assign them a unique identifying number or have them assign one to themselves. Participants often forget their numbers over the course of an intervention, and you can’t keep track of them without denying confidentiality of data. This leads many people to just lump all of the data from all participants in a group together to compare an aggregated score at pre-and post, but your argument about having made a change can be strengthened by being able to disaggregate and look at the how individuals changed.
Practically, retrospective measures allow you to make adjustments to your measurement instrument to address the intervention as it was implemented rather than as you expected to implement it (Pratt, McGuigan, & Katzev, 2000). This can be helpful if, for some reason, you do not implement all sessions of a curriculum. Finally, some preventionists report that retrospective instruments are preferable to using pre- and post-tests because they do not get in the way of building rapport when an initiative begins.
What are the pitfalls or drawbacks of the retrospective design?
This design shares drawbacks with the pre- and post-test design. It is not a good tool for directly assessing changes in knowledge. Social desirability bias continues to be an issue, even in the example above, and some studies even suggest that social desirability bias might be more significant using a retrospective design (Hill & Betz, 2005).
Integrated & Ongoing Data Collection
In addition to collecting data before and after implementation, you can also collect data (of various sorts) while the intervention is underway. Sometimes you might use the same instrument or data collection method to do this (e.g., questionnaires), but you can also use this as a way to collect different kinds of data. Collecting various kinds of data is one form of triangulation (Patton, 2014) and is good practice for getting a deeper understanding of an issue and also for making sure you have valid data. Also, different kinds of data serve different purposes.
What are the benefits of collecting data during an intervention?
If you collect data during an intervention, you have a chance to see if you’re on track toward meeting your intended outcomes or if you need to make midcourse adjustments to create the kind of change you seek to create. This type of data can also be collected to provide quick feedback to people who are implementing the program so that they can continuously improve their efforts throughout implementation. For example, some preventionists have teachers or other observers complete observations about the way the preventionist facilitates activities and conversations and provide them with improvement-oriented feedback based on the observations.
Certain data collection methods can be used unobtrusively during the intervention to collect data without interrupting the flow of the intervention. Other data collection methods can become part of the intervention and serve the purpose of furthering your work toward your outcomes while also giving you information about how far you’ve come at a certain point. Some forms of observational data collection and activity-based evaluation are good examples of this type. Skye Kantola discusses the ways that activity-based assessment can be used as a way to assess community needs and measure community-building methods in this NSVRC podcast.
Collecting data during the intervention can offer seamless opportunities for participatory data collection. One way participants can be involved in data collection is by observing peers within their classrooms or schools or observing the larger community around them, depending on the type of intervention and evaluation questions.
 Watch this NSVRC Mapping Evaluation video podcast with Maya Pilgrim to see how a facilitator checklist can help preventionists identify the things that work during a prevention program
What are the drawbacks of collecting data during an intervention?
Ongoing data collection can be a person-intensive endeavor requiring the preventionist, participants, and others to frequently or consistently engage in data collection. The data then needs to be analyzed and interpreted. Additionally, the data can be time-sensitive. That is, for the data to be maximally useful, it needs to be analyzed and processed in time for it to facilitate a course correction if one is needed.
From Whom?
From whom do you need to collect data in order to answer your evaluation questions with a relative degree of certainty?
You do not need to collect data from each and every person who participates in your programming. Right now, you might be thinking, “What? I’ve always tried to get every single person to fill out a survey or take pre-and post-test!” If you’re thinking this, you might also be one of those people with file cabinets full of data that you’ve never quite figured out how to use – or maybe you’ve never quite figured out how to find the time to enter all of the data into a spreadsheet so that you can run analyses on it.
Sampling is the process of strategically selecting a subgroup of participants (or another population of interest) from whom to collect data in response to your evaluation questions (Taylor-Powell, 1998). The general practice of sampling involves trying to collect data from a subgroup that somehow represents the overall group. For example, if you’re working with four 11th grade health classes in the same high school, and they represent similar distribution of the school population, you might decide to collect data from only two of the classes. If, however, one of those classes consisted entirely of athletes, it would not be representative of the 4 classes as a whole.
Other sampling practices might involve deliberately sampling particular groups of people. For example, an evaluator might oversample a particular subpopulation if they are not well-represented in the overall group, but data about the population stands to tell a particularly important story. This practice can help amplify the voices and experiences of marginalized groups.
Like many other aspects of evaluation, a variety of factors influence decisions about sampling (Taylor-Powell, 1998), including
- Resources – From how many people can you reasonably collect data? How much data do you have the time and person-power to input, clean, analyze, interpret, and use?
- Questions – What do your evaluation questions indicate about what you need to know and about or from whom you need to know it? What kind of claims are you seeking to make about your initiatives? For example, if you’re trying to make strong claims about the contribution of your intervention to particular outcomes, you might need to use more rigorous sampling procedures and seek a larger sample than if you’re evaluating more for program improvement.
- Philosophy/Approach – Different philosophies about and approaches to evaluation suggest different approaches to sampling.
Tip
When making decision about sampling, keep in mind that data collection stands to impact the participants and the intervention in ways that could either contribute to or detract from the intended outcomes. For example, if you conduct focus groups at any point in your program, these focus groups might count as an additional dose of learning that can assist with integration of concepts from the intervention.
 Resources
Sampling: ($) A great overview of sampling for program evaluation is available in this resource from the University of Wisconsin-Extension.
Decision Tree for Selecting Sampling Methods (PDF 1 page) The
Ohio Primary Prevention of Intimate Partner Violence & Sexual Violence Empowerment Evaluation Toolkit includes a simple decision tree to help with selecting sampling methods.
How?
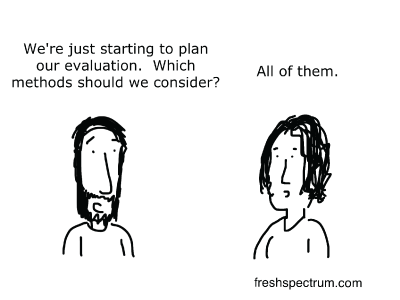
When you consider how you will collect data to answer your evaluation questions, you might first think about questionnaires or other written instruments for data collection. Written instruments are just one of the many options for data collection, each of which has benefits, drawbacks, and appropriate applications. Method selection needs to be driven by your evaluation questions, resource availability, and expertise among your evaluation team.
What kind of data do you need?
 Before making decisions about the tools you will use to collect data, it will be helpful to understand the difference between qualitative and quantitative data.
Qualitative data is descriptive and include words, images, observations, existing documents, and other non-numerical data.
Example: If you hold a focus group, the data you are collecting consist of the responses participants give to questions you ask. These data are in the form of words. If you conduct a PhotoVoice project for data collection, the photos taken by participants, along with the words they use to describe those photos, are the data you collect.
Quantitative data consists of numbers themselves or of numbers that represent discrete concepts.
Example: If you count how many people attend various events, the numbers of those counts are quantitative data. When you use questionnaires that present questions or statements with scales (for example, a scale that assesses the level to which people agree with a certain statement), the items on the scale usually correspond to numbers and are quantitative data.
Generally, evaluators see quantitative data as being somewhat less time consuming to collect and as offering more opportunity to generalize findings since data can be collected from far more people. Qualitative data, then, offer a rich picture and context of how people and communities change. If qualitative data are collected from only a small or select group of people, the ability to make statements about how much that information applies to other people is limited. Keep in mind that these are general views and not the only views.
“The evaluation ideal is: No numbers without stories; no stories without numbers.” (Patton, 2014, p. 13)
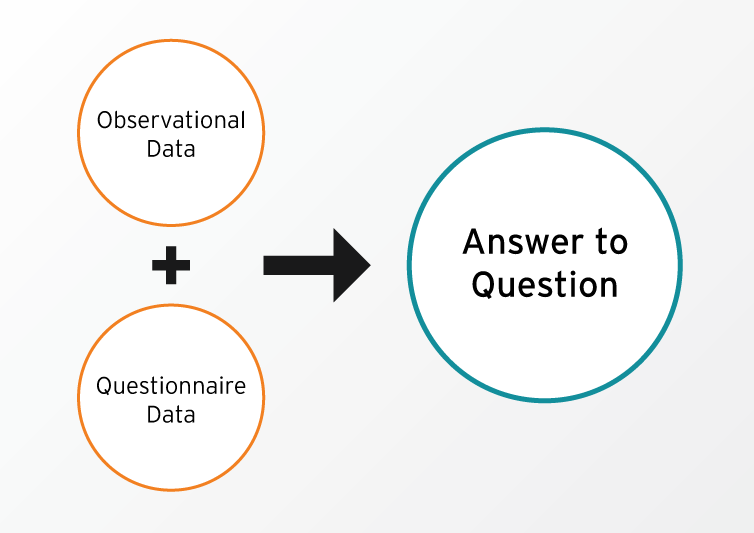
 As the quote above suggests, a mixed- method (both quantitative and qualitative) approach is seen by some as the best way to get a good picture of what is happening with a program or initiative. For example, you might use a questionnaire to collect data about participants’ intent to engage in bystander behaviors. For additional context you might then hold a focus group to find out more about why people did or did not increase their intent to intervene over the course of the program.
Several sources of data to answer evaluative questions exist. The trick is to figure out the best way to collect data that will answer your specific questions. The data you gather can be collected in ways that are more or less intrusive. That is, you might collect data in ways that are very obvious to program participants (e.g., having them complete surveys) or that are less obvious to program participants (e.g., reviewing existing records). Data collection methods that are less intrusive have less impact on the program participants and context.
What kind of data will be credible for you?
If you think about the data you collect as helping you tell a story about your work, you need to consider which kinds of data will help you tell a story that will be regarded as credible by the various people to whom you will tell the story. What kind of data will help tell a credible and meaningful story to the participants who are part of your program? Will that data be the same or different than what is valued by your funders? How will you reconcile any differences between the two?
Planning for data collection can be both an exciting and daunting project. As curious human beings, we often find ourselves with more questions than we can reasonably answer in the course of an evaluation. Also, when we start to think about data collection, we easily fall into the trap of following our curiosity rather than following our questions. Remember: data collection serves a particular evaluation need and needs to have useful purpose.
What kind of data will answer your evaluation questions?
Keep in mind that you might need to collect multiple types of data to get a sufficient answer to your evaluation question, even if your evaluation question focuses primarily on whether or not you met your stated outcomes. Considering your evaluation questions, ask yourself, “How will I know?” For example, if your question focuses on “Did we meet our outcomes?” You need to ask “How will I know if our outcomes are met?” Think about what will be different in what you or others see, hear, etc.
The same goes for the questions that are not tied to the achievement of your outcome. So, if your question is, “How meaningful were the outcomes to program participants?” Then you need to ask, “How will I know if they were meaningful? How will I know if they were only a little meaningful versus if they were significantly meaningful?”
Generally, we consider the answers to these questions to be indicators. Indicators are more specific than outcomes and more directly measurable. In order to fully answer evaluation questions, you might need to collect data about multiple indicators, which might show up through various kinds of data. When you start brainstorming indicators, you might discover many indicators will help answer your question. Choose ones that are meaningful, easy to collect, and closest to your questions.
You can use the Mapping Data Sources to Evaluation Questions handout to help guide and keep track of your thinking.
|
Example 1 If you are implementing a bystander intervention program, observational methods can help you see if participants are using bystander intervention skills, how well they are using them, if they are using them in the appropriate moments, and whether or not those skills are proving effective. (For specific ideas about how to do this, check out Appendix C of Activity-Based Assessment: Integrating Evaluation into Prevention Curricula [Curtis & Kukké, 2014].) To gather information about social norms change, you might additionally look at how members of the community respond to the bystander when they intervene. For example, do people ignore the intervention or do others join in to help? The latter would be suggestive of a norm in favor of bystander intervention. Example 2 If you are trying to build healthy relationship skills among a group of people, over time you can track their use of those skills during the program sessions. |
Observational Data
Overview
Observational data come from directly observing behaviors of program participants or other members of a target audience or community. Collecting observational data is appropriate for understanding how people behave in their environments and how or if they enact new skills that they’ve learned.
Process
Observational data collection can be time-consuming if observations are happening independent of an intervention, like example 1 above. However, observational methods can also be integrated into an intervention so that data collection happens at the same time, as seen in the second example. Ideally, more than one person will collect the data. Some preventionists train classroom teachers to assist with observational data collection either during the sessions the preventionist facilitates, between sessions, or after the completion of the program.
Data are usually collected using pre-determined criteria so that all data collectors know what to look for and can track similar behaviors. Data collection sheets (also called rubrics) might be organized to collect
- whether or not a behavior was observed,
- how often a behavior was observed,
- how many people engaged in a behavior, or
- how well people implemented the behavior (Curtis & Kukké, 2014).
Although this can take a lot of preparation in the beginning to design collection sheets and train observers, the data it provides can be uniquely useful for initiatives that aim to change people’s behaviors.
Participatory Opportunities
Observational data collection offers a great opportunity for participatory program evaluations. Ideally, participants will help determine what types of observations to conduct, when, and of whom. Then, they can be trained to participate in the collection of the data.
Focus Groups/Interviews
Overview
Focus groups and interviews provide opportunities for you to directly interact with individuals to get their thoughts, feelings, and reactions to a series of questions related to your evaluation question. These are also often used in needs assessments because they can provide detailed perspective and context about the strengths and needs of a given community. Although time consuming, the richness of the data you receive from focus groups or interviews can be critical to helping you more fully understand data you have collected through other means.
Process
To conduct focus groups or interviews, you need to design questions and decide who will either be interviewed or invited to participate in the focus group. Both of these methods require careful note taking or audiotaping and transcription, so you will need to build in time and resources for that. If you go the note-taking route, it is best to have one person facilitating and one person taking notes. If you want to audio-tape interviews or focus groups, make sure to get everyone’s permission to do so and let them know how the recordings will be used.
Participatory Options
Invite participants to help design questions or generate ideas about who should be interviewed or included in the focus group. You can also train participants to conduct the interviews or facilitate focus groups. Methods like Most Significant Change can be implemented in a participatory way by having participants interview each other. Check out this video podcast with Dee Ross-Reed about how key informant interviews can help uncover program successes and ways evaluation can be modified to better meet the needs of the community.
Existing Data/Documents
Overview
Some of the data you need to help answer your evaluation questions exists in materials put together by external sources. This might include newspapers (including school newspapers), documents from other nonprofits, data collected by state agencies, and so on. If other entities are collecting or providing data you need, there’s no reason to collect it yourself as long as you can get enough information to determine how valid or reliable the data might be and how applicable it is to your specific question. Additionally, documents produced by or about given communities (e.g., in newspapers) can give you a sense of the community values and norms and how they shift over time.
Process
The process for working with existing data or documents is relatively straightforward. To use existing data or documents, you need to determine what you are looking for and how the existing data will supplement any other data collection you do. Determine in advance what you might be looking for in the existing data that you’re using. This is another place where a rubric might be appropriate. You then need to collect whatever the specific data sources will be, whether that’s community newspapers, state survey data, school records, or another source.
Participatory Options
Participatory opportunities include the process of collecting the data artifacts and also the process of pulling and analyzing the data found in them. For example, you might involve students in collecting archival information to ascertain how gender norms have operated in their school over time; they could pull information from school newspapers and yearbooks.
Questionnaires
Overview
Questionnaires (which you might also think of as pre/post-tests or surveys) might be the most frequently used data collection method among preventionists. With questionnaires, you design questions that seek to assess particular constructs (e.g., adherence to rigid gender roles).
Process
After determining which constructs you want to measure with a questionnaire, you need to write questions that address that construct or use questions from existing measures. Ideally, questions will be piloted prior to use so that you can make sure the language in the questions makes sense to the target population and determine the extent to which the questions measure what you think they are measuring. You will also need to decide how you will administer the questionnaire. Options include
- paper and pencil
- online (e.g., through a service like Survey Monkey)
- interactively/kinesthetically
- orally
Participatory Options
Participants can be involved in helping develop questions, piloting measures, and even administering the questionnaire.
Creative Materials
Overview
Over the course of an intervention, participants or community members might produce a variety of artistic materials that can be used as data. For example, community members might construct a mural about what healthy communities look like or youth in a school-based program might be asked to take photos that represent healthy, respectful interactions both before and after an intervention.
Process
If you want to deliberately build in creative opportunities that are explicitly and deliberately evaluative, you will need to determine prompts for the creative expression that will inspire participants to produce materials that will have content relevant to your evaluation questions and indicators. For example, there’s a significant difference in asking people to take photos that represent what the program or initiative meant to them and asking them to take photos of what they think the impact of the program or initiative was on the people around them.
Participatory Options
Many creative methods are inherently more participatory than non-creative ones. For example, PhotoVoice involves participants in taking photos in response to a prompt, and then they are able to share both their photos and their thoughts/reasons for taking their photos. They can also then collectively participate in the process of making meaning of an entire group’s photos. Cierra Olivia Thomas-Williams gives a glimpse into how PhotoVoice was used in a community-specific prevention program with unexpected results in this NSVRC Mapping Evaluation video podcast. Find out more about this project and the tools they used by reading this guide: Sidewalks to Sexual Violence Prevention: a guide to exploring social inclusion with adults with developmental & intellectual disabilities.
DATA SOURCE |
PREVENTION EXAMPLES |
|
OBSERVATIONAL DATA Observational data come from directly observing behaviors of program participants or other members of a target audience or community. |
|
|
FOCUS GROUPS/INTERVIEWS Focus groups and interviews are opportunities to get detailed descriptive data including people’s perceptions about their experiences in a program and reflections on how they have changed. |
|
|
EXISTING DATA/DOCUMENTS Existing documents include materials or records that are collected external to your evaluation efforts but which you might be able to access to assist in answering your evaluation questions. |
|
|
QUESTIONNAIRES Questionnaires include questions and other items to gauge people’s attitudes, behavioral intent, knowledge, and other constructs. |
|
|
CREATIVE MATERIALS Artistic and creative products like drawings, photos, murals, journal entries, poetry, etc. are also sources of data for evaluation. |
|
If you want to brainstorm options for your own data collection based on these categories, download the Identifying Data Options worksheet.
References
Curtis, M. J., & Kukké, S. (2014). Activity-based assessments: Integrating evaluation into prevention curricula. Retrieved from the Texas Association Against Sexual Assault: http://www.taasa.org/wp-content/uploads/2014/09/Activity-Based-Assessment-Toolkit-Final.pdf
Harvard University Program on Survey Research. (2017). Tip sheet on question wording. Retrieved from http://psr.iq.harvard.edu/files/psr/files/PSRQuestionnaireTipSheet_0.pdf
Hill, L. G., & Betz, D. L. (2005). Revisiting the retrospective pretest. American Journal of Evaluation, 26, 501-517. doi:10.1177/1098214005281356
Nimon, K., Zigarmi, D., & Allen, J. (2011). Measures of program effectiveness based on retrospective pretest data: Are all created equal? American Journal of Evaluation, 32, 8-28. doi:10.1177/1098214010378354
Patton, M. Q. (2014). Evaluation flash cards: Embedding evaluative thinking in organizational culture. Retrieved from Indiana University, Indiana Prevention Resource Center: http://www.drugs.indiana.edu/spf/docs/Evaluation%20Flash%20Cards.pdf
Pratt, C. C., McGuigan, W. M., & Katzev, A. R. (2000). Measuring program outcomes: Using retrospective pretest methodology. American Journal of Evaluation, 21, 341-349. doi:10.1016/S1098-2140(00)00089-8
Taylor-Powell, E. (1998). Sampling. Retrieved from University of Wisconsin-Extension: http://learningstore.uwex.edu/assets/pdfs/G3658-3.pdf
| Back | Index | Next |